Of course it will…
It’ll be like a greased Whippet (it’s a Yorkshire thing).
All those lovely high performance components.
All working just for me and no one else.
How could it be slow?
Of course it’ll be fast.

Background
We recently put in place a brand new shared hosting server with all the bells and whistles we normally run on our web hosting and our standard hosting stack of:
- Litespeed Enterprise Web Server
- Cloudlinux OS
- Imunify360 Malware Protection
The only major change was that instead of cPanel this one would be running Plesk and instead of SAS SSD drives it would be running with the latest NVMe SSD.
We installed the server, configured all the services as we normally would and copied over some test sites and ran our usual barrage of tests, so far, so good and everything matching up to our expectations of amazing speeds.
First customer web site
Fast forward to the first customer site, in this case a staging site to test things ahead of the live website being moved over to our hosting, and all is not well.
Suddenly instead of 400ms load times for the login page, we’re seeing 3 to 4s load times depending on the page, clearly something wasn’t right.
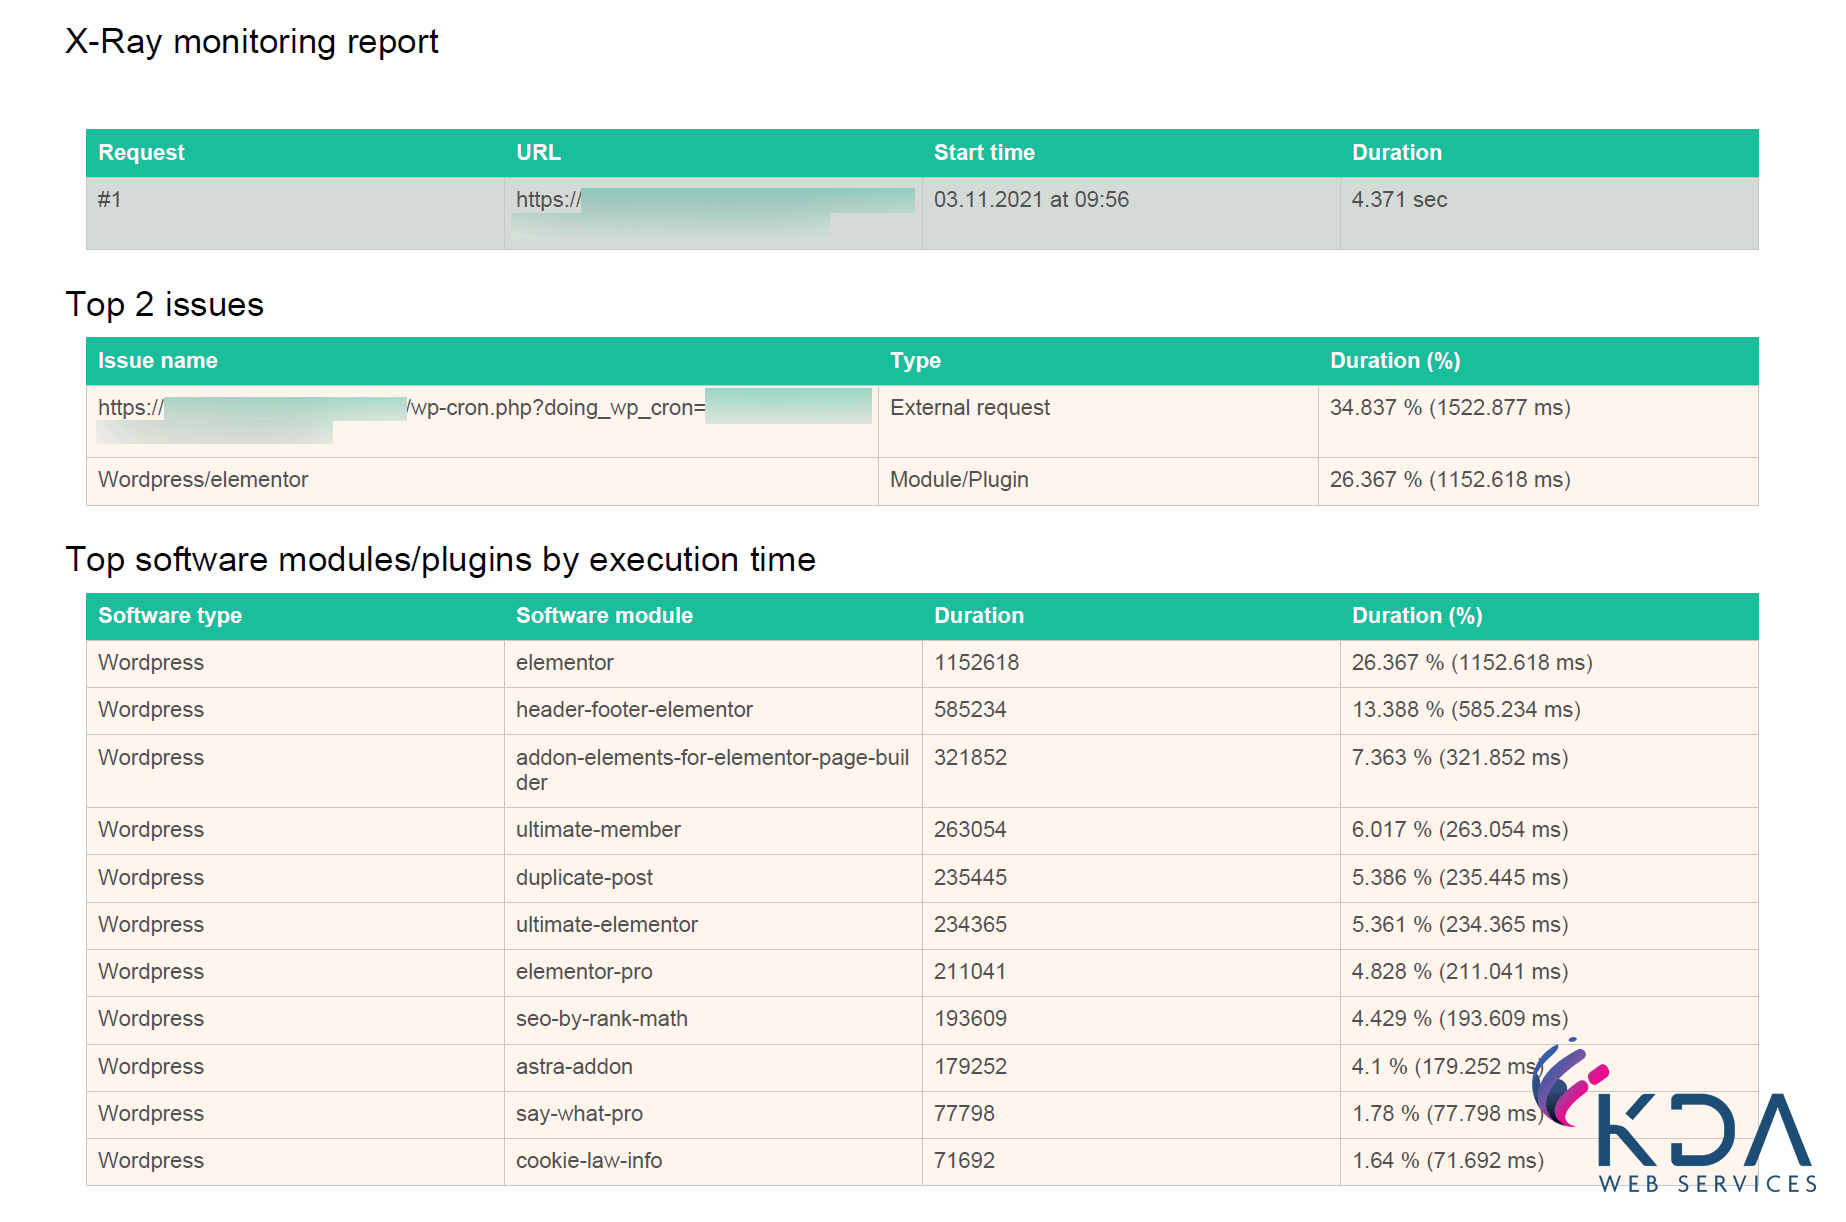
Initially we thought this might be down to WordPress doing something odd with our setup so that’s where we started digging, doing a full X-Ray analysis of some page loads. Whilst 60% of the time was spent within the page builder and the various addons for it, there was nothing obviously wrong, other than everything taking a bit too long.
We checked
- PHP versions between old and new – we were newer (7.2 vs. 7.4) so should have been marginally faster
- The web server software between old and new – same Litespeed Enterprise install
- The hardware the old host was running – comparable performance
- Caching – nope, the old setup wasn’t caching anything
- Limits – Not hitting any CPU/memory limits on the account
It must be the server
How though?
This is a server with:
- 32 Cores (2.4-3.2Ghz)
- 128GB RAM
- Enterprise NVMe Drives
Whilst we’ve got more powerful servers, this is not a slow low specification server by any stretch of the imagination.
To try and rule the server in/out as being the problem we made another copy of the site and placed it on our most recent cPanel shared hosting server which is configured with the same Cloudlinux OS + Litespeed + Imunify360 stack and the login page loads in < 2s
It is the server then….
What? Why? How!?!?!?
This didn’t make any sense, as all of our pre-customer testing had shown comparable results to the cPanel server we’d just tested it on. What was different between this testing and the results we were seeing whilst browsing the site? Why wasn’t the result on the cPanel server more like the original host?
Aha… we’re using the site a lot slower than our test routine does because we’re looking at things in between page loads etc. Our test routine is much more of a “throw requests at the server until it screams for mercy” so very different with no gaps between page loads.
We’re on to something with this now…
PHP and OpCache
PHP isn’t a compiled language, you upload your script to the server and that’s what it uses, no compiling required. This means every time it wants to run your code though, it has to compile it down to the required bytecode and run it. With WordPress that can be a lot of code to compile. One way of alleviating this is using something called an OpCache which stores the compiled bytecode, usually in memory, ready for the next time it is needed.
This is what we were seeing with the quickest requests, the page request was running from the OpCache and the slower ones were being compiled, stored and run and the OpCache actually adds some overhead for code that isn’t in the cache as well.
As this was only a staging website, the only traffic at all to it was us testing it, no search engines crawling it, no bots looking at it for vulnerabilities etc. and this meant that the idle timeouts on the parent PHP process were expiring and removing the parent process and the OpCache compiled code with it. We saw this across the cPanel and Plesk servers.
Problem #1 solved – increase the timeouts, make the OpCache live longer in memory and look at enabling file backed cache for first startup of the OpCache, now we’re down to all loads being the faster of the two times.

It’s good to be green
We try wherever we can be friendly to the environment, and that means trying to reduce the electricity we use, even though it comes from renewable sources and we carbon offset as well. This means we allow our servers to make use of power saving features built in to the processors (CPU) and go in to lower power usage states when there’s no work to be done, and come back up to higher power states when work needs doing. The downside of this, is that it takes a little bit of time to switch between these states, a tiny tiny amount of time, but it can add up.
Normally you’d never notice this, because the peaks and troughs in CPU usage across different sites tend to average each other out, as one site/request is done with the CPU core another takes over and it doesn’t really need to go in to a lower power state for that CPU core, this is somewhat of a simplification, as the peaks and troughs can actually happen within a single page request as well.
By now you’ve probably worked out what the issue is…
Ain’t no mountain high…
Ain’t no valley low… There’s really no other load on the server, it’s actually too quiet with not enough usage so there are no peaks and troughs to even out and the server is constantly going to a lower power mode, even in the middle of requests if it is waiting on something.
Problem #2 solved – For the time being, stop the server going in to lower power states, with a view to re-enabling it once there’s enough load to prevent issues with lower power modes. Now we’re down to those 300-400ms times.
What we’ve learnt
Hands up, we were caught off-guard with this, but we aim to be transparent and open. It’s very rare for us to put a new server in and not have a reasonable amount of load to put on it right away, as with new shared hosting servers we’re often replacing hardware or we moved some customers around just to balance things out, or with more complex sites there’s often several people testing it at once placing more load on the server.
Lesson #1: Don’t just assume that because it’s a fast server we’ll get #amazing speed for tiny workloads
Lesson #2: We need to change our pre-customer testing to better match real user behavior to catch issues like this
Outcome: We’ve changed our server commissioning procedure to check what power mode is going to be most appropriate based on the workload expected and our default software configuration has been updated to reflect lower workloads as well and we’ll refine our testing.
Even after 20 years we can still be surprised and have room for improvement in our procedures and processes.
We’re very grateful to our customer who let us work through this performance issue for them.


